Jun 032024
 

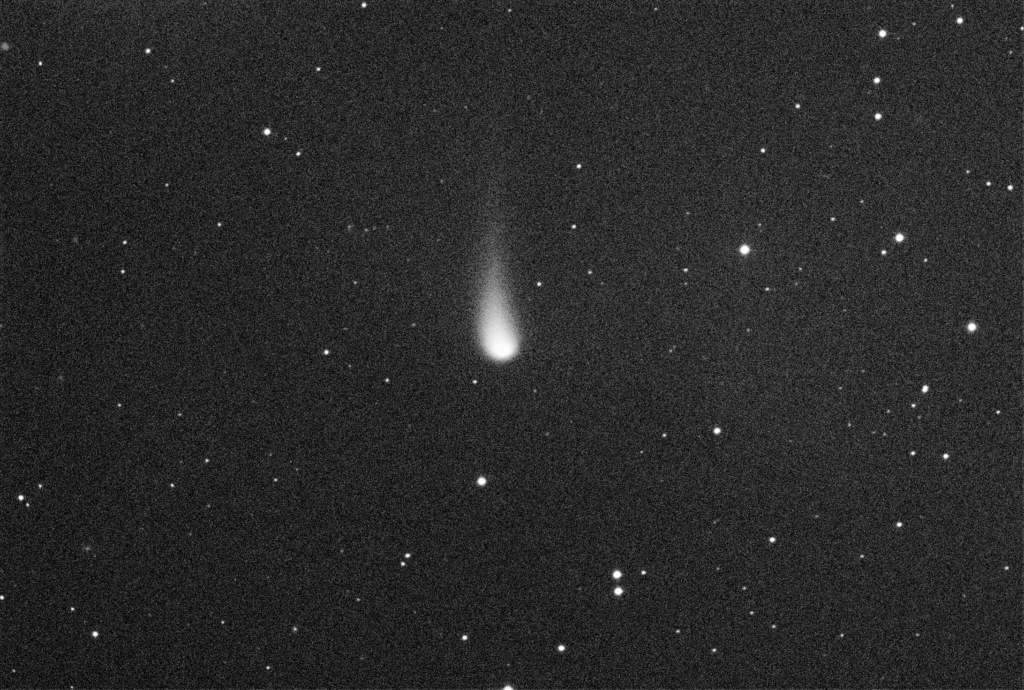
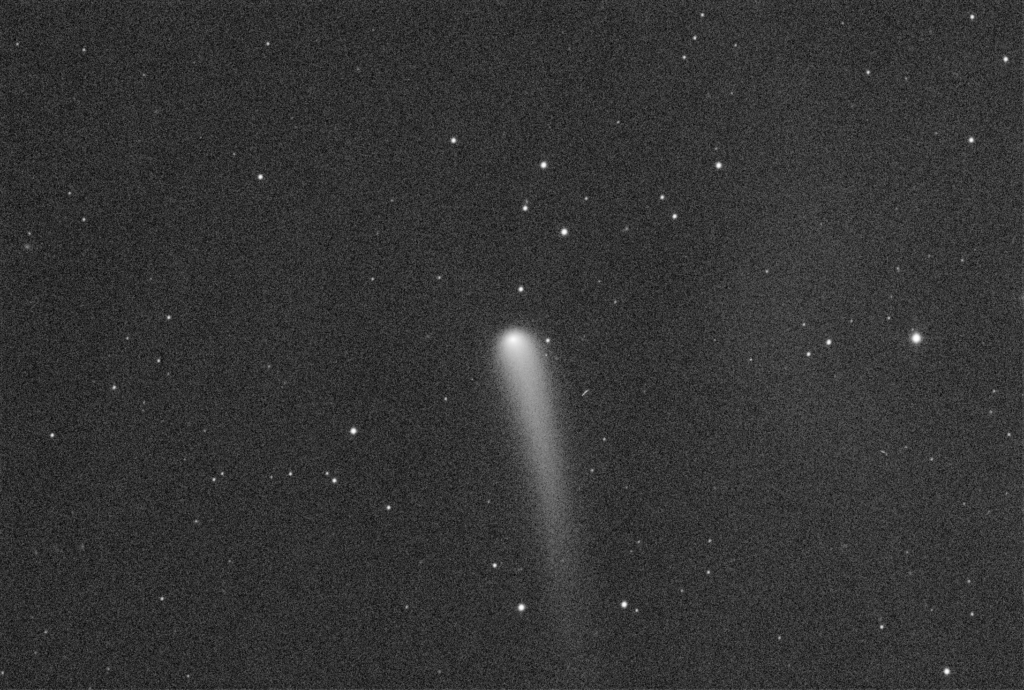
Here’s the June update on the approaching comet C/2023 A3 (Tsuchinshan–ATLAS). It looks like I will need to offset the comet in future images to make sure I get the entire tail. The comet is well placed for observing. It is in the currently in the constellation Virgo and crosses the meridian around 2000 CDT.

Comet C/2023 A3 (Tsuchinshan–ATLAS)[CV:1x60s]

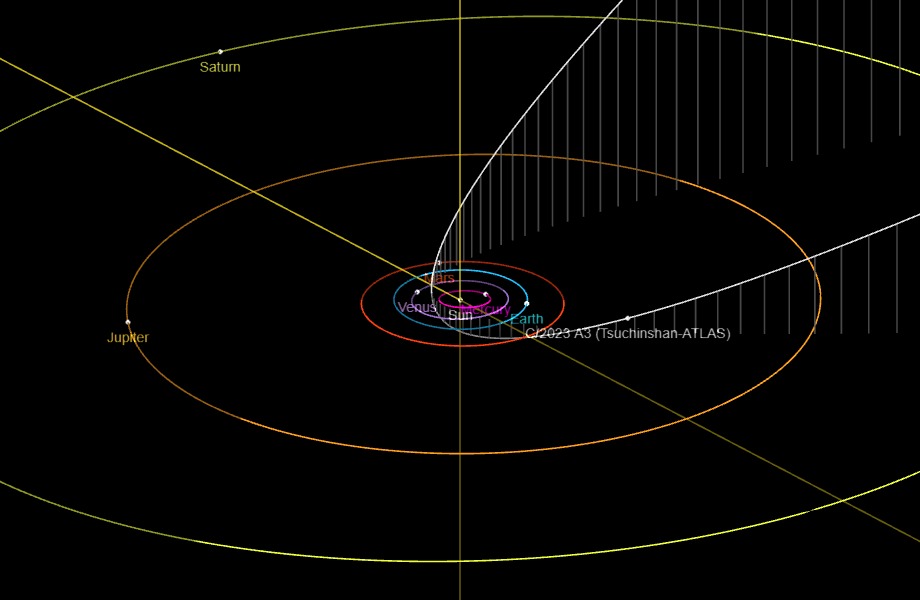
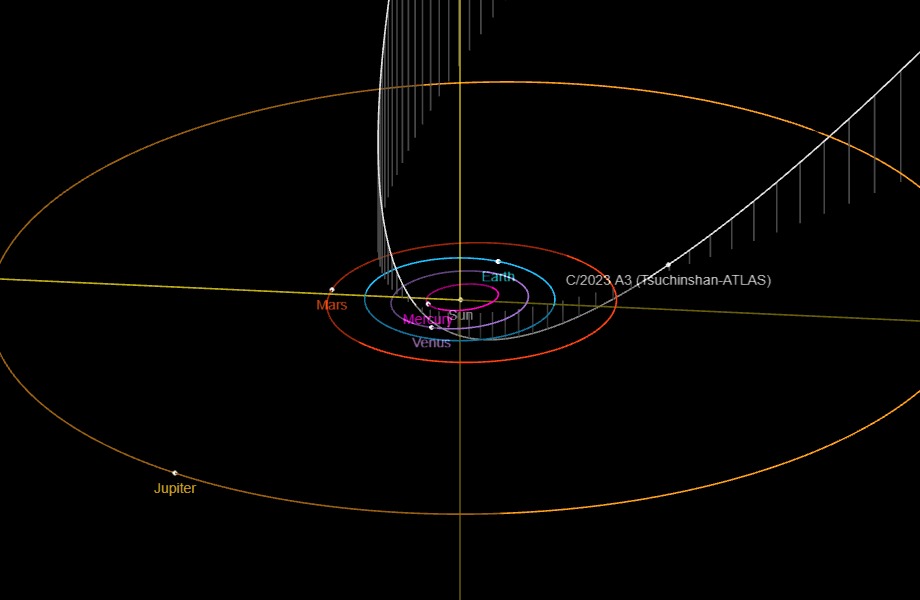
As the orbit illustration shows, the comet is still outside Mars’ orbit and now approaching the plane of the solar system for a crossing on the 6th of Aug. It is still on track for a perihelion on the 27th of Sep 2024.

C/2023 A3’s orbit.
(Graphic courtesy of the JPL Small-Body Database Browser)

 Posted by at 15:11
May 032024
 

Comet C/2023 A3 is starting to develop a nice tail. Recent measurements put the total magnitude at 6.5 and the nuclear magnitude at 9.1.

Comet C/2023 A3 (Tsuchinshan–ATLAS) [CV:1x60s]

The comet is still well outside of Mars’ orbit.

C/2023 A3’s orbit.
(Graphic courtesy of the JPL Small-Body Database Browser)

Roving bands of clouds limited me to one 60 second image. Just so you can compare, this image was taken with the same scope/camera configuration as the image on the 6th of March.

 Posted by at 15:16
Mar 112024
 

C/2023 A3 (Tsuchinshan–ATLAS) AKA CK23A030 is a long period Oort cloud comet. It was first discovered on the 9th of January by the Purple Mountain Observatory near Nanjing, China and then again, independently, by the ATLAS system in South Africa on the 22nd of Feb. The comet’s perihelion will occur on the 27th of September 2024 and then pass closest to the Earth less than a month later on the 12th of October. CK23A030 is in a retrograde orbit and is currently above the ecliptic. It will dip below it in the middle of June and back above it the beginning of October.

This image is a stack of 11 images centered on the comet taken on the 6th of March. On that date, the comet’s magnitude was 12.6 but since it is still on its inbound leg and considerably outside the orbit of Mars, it should get much brighter by the end of the year. It has the potential to get bright enough for naked eye visibility, but it is a comet, and comets pay no attention to astronomer’s predictions.
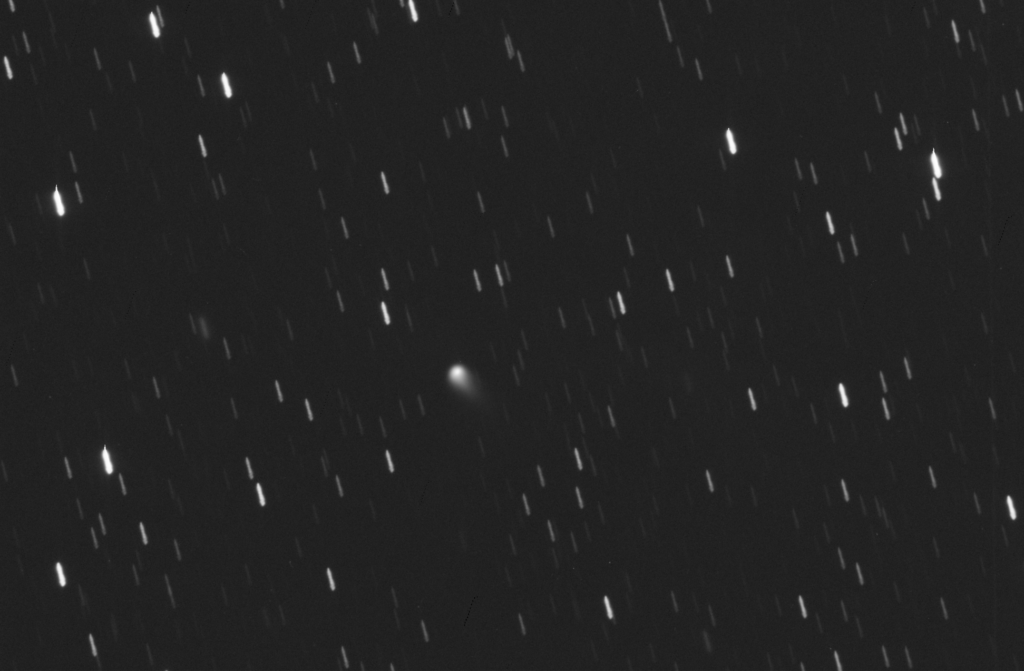
Comet C/2023 A3 (Tsuchinshan–ATLAS) [CV:11x300s]
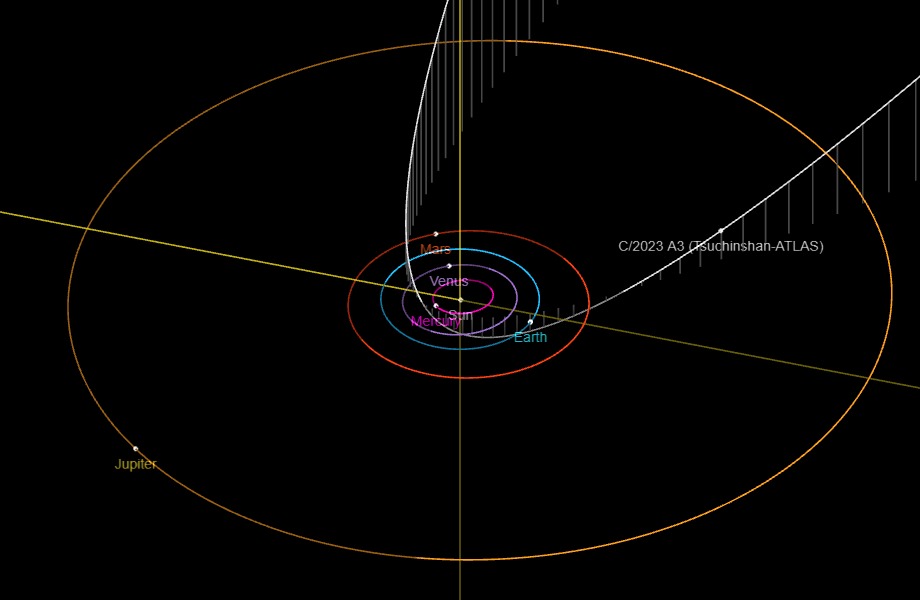
C/2023 A3’s orbit.
(Graphic courtesy of the JPL Small-Body Database Browser)

The length of its orbit around the Sun, prior to this close pass, was in the millions of years but getting this close may modify the orbit to hyperbolic and eject the comet from the solar system. The orbit chart is current as of 11 March.
 Posted by at 03:41
Jan 042024
 

The jet stream forecast was favorable over the year end break, so I reconfigured the PTO to planetary mode and got a few series of LRGB imagery while the sky was clear. All the images were analyzed for impacts and reports were submitted.

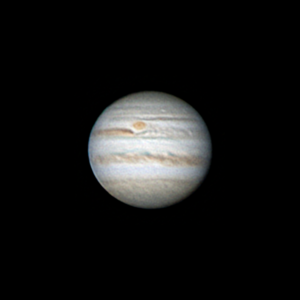
Jupiter [(V) L:1658×1.06ms; R:1661×1.71ms; G:1618×1.56ms; B:1840×2.25ms]

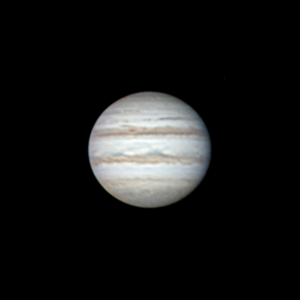
Jupiter [(V) L:3477×1.2ms; R:2280×1.96ms; G:3281×1.75ms; B:3475×2.9ms]

The image on the left showing the Great Red Spot was taken on the 30th and the right image was taken on the 1st. As usual south is at the top.

 Posted by at 14:24
Nov 032023
 

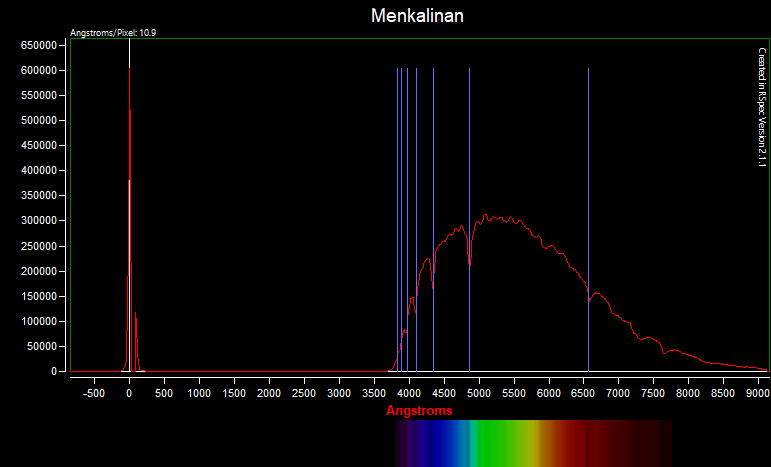
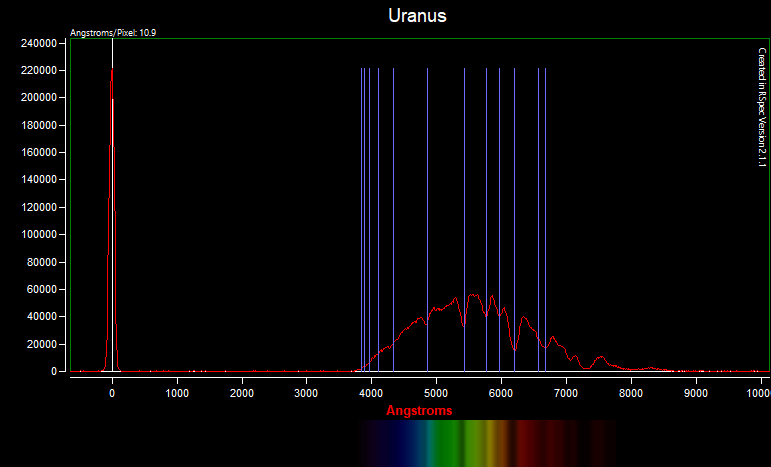
I was lucky enough to get permission to assist a local STEMM student with a science fair project. The project involved spectroscopy and I was able to put my filter wheel mounted Star Analyzer 200 to good use. I was able to get images of stars in each major spectroscopic class. I was also able to get the spectrum of Uranus as a system capability test. I use the RSpec software program to process the spectra. Although I use a monochrome camera, the package is capable of synthesizing a color spectrum once it is calibrated. That is what is displayed under the spectrum profile chart.

A class A star has very prominent hydrogen absorption features in its spectrum. This makes it a good target for calibrating a spectrographic system. Elements in a star’s atmosphere absorb specific frequencies of light which are unique to the element. This is why we see a dip in the light’s intensity at that point. The dips in this spectrum, indicated by the blue lines, are due to hydrogen absorbing the light. This set of frequencies are known as the hydrogen Balmer series.

Menkalinan – Class A star

I also took an image of Uranus just to see what the SA-200 was capable of. The blue lines in this instance identify the frequencies of light that methane would absorb. As you can see there are significant dips in the spectrum at those frequencies.

Uranus

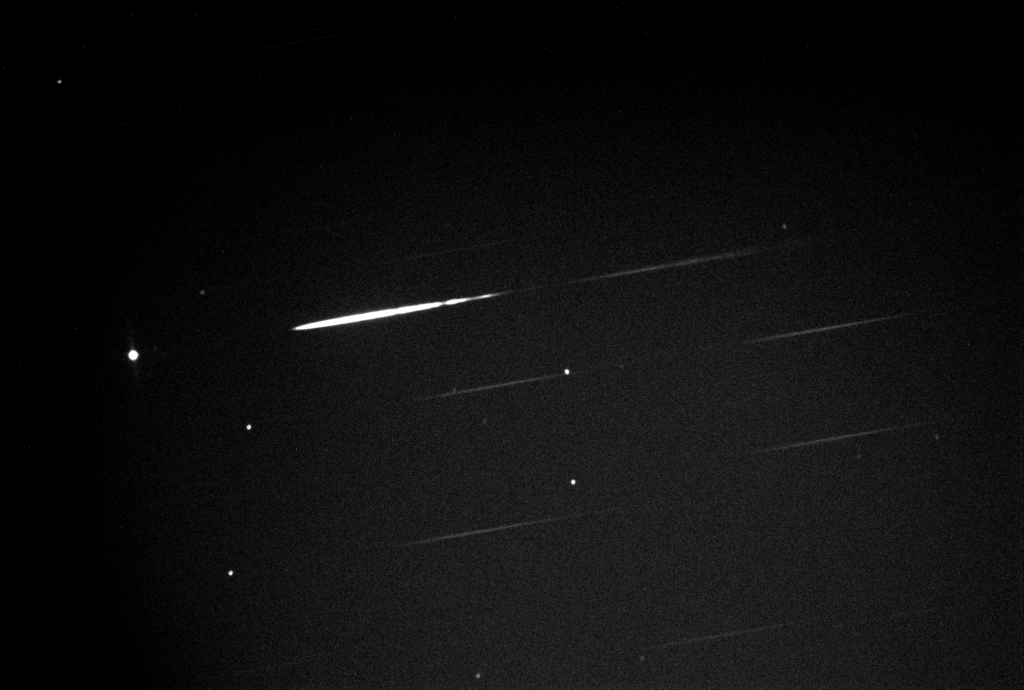
This is the image of Uranus that was processed by RSpec to produce the profile chart. The brightest spot is Uranus and the brightest streak to the right of Uranus is its spectrum. The other 4 obvious spots are magnitude 10 background stars.

Uranus [D2:1x5s]

 Posted by at 15:21