I was lucky enough to get permission to assist a local STEMM student with a science fair project. The project involved spectroscopy and I was able to put my filter wheel mounted Star Analyzer 200 to good use. I was able to get images of stars in each major spectroscopic class. I was also able to get the spectrum of Uranus as a system capability test. I use the RSpec software program to process the spectra. Although I use a monochrome camera, the package is capable of synthesizing a color spectrum once it is calibrated. That is what is displayed under the spectrum profile chart.
A class A star has very prominent hydrogen absorption features in its spectrum. This makes it a good target for calibrating a spectrographic system. Elements in a star’s atmosphere absorb specific frequencies of light which are unique to the element. This is why we see a dip in the light’s intensity at that point. The dips in this spectrum, indicated by the blue lines, are due to hydrogen absorbing the light. This set of frequencies are known as the hydrogen Balmer series.
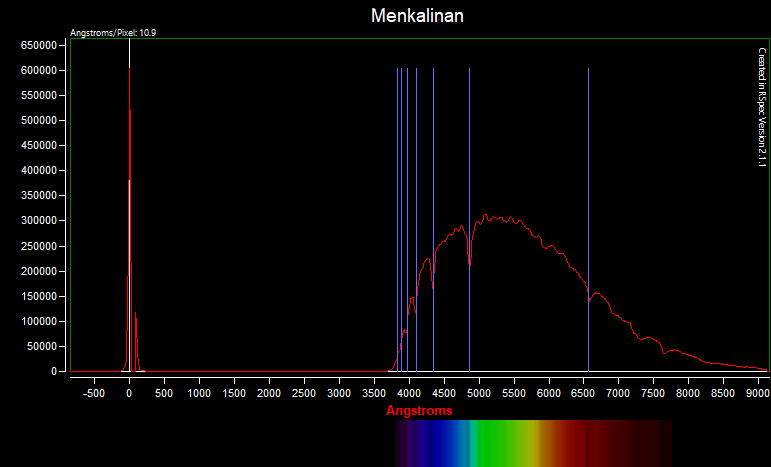
Menkalinan – Class A star
I also took an image of Uranus just to see what the SA-200 was capable of. The blue lines in this instance identify the frequencies of light that methane would absorb. As you can see there are significant dips in the spectrum at those frequencies.
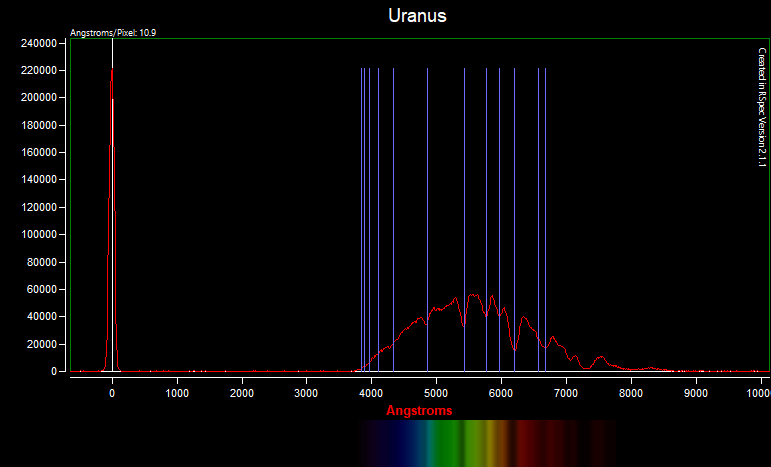
Uranus
This is the image of Uranus that was processed by RSpec to produce the profile chart. The brightest spot is Uranus and the brightest streak to the right of Uranus is its spectrum. The other 4 obvious spots are magnitude 10 background stars.
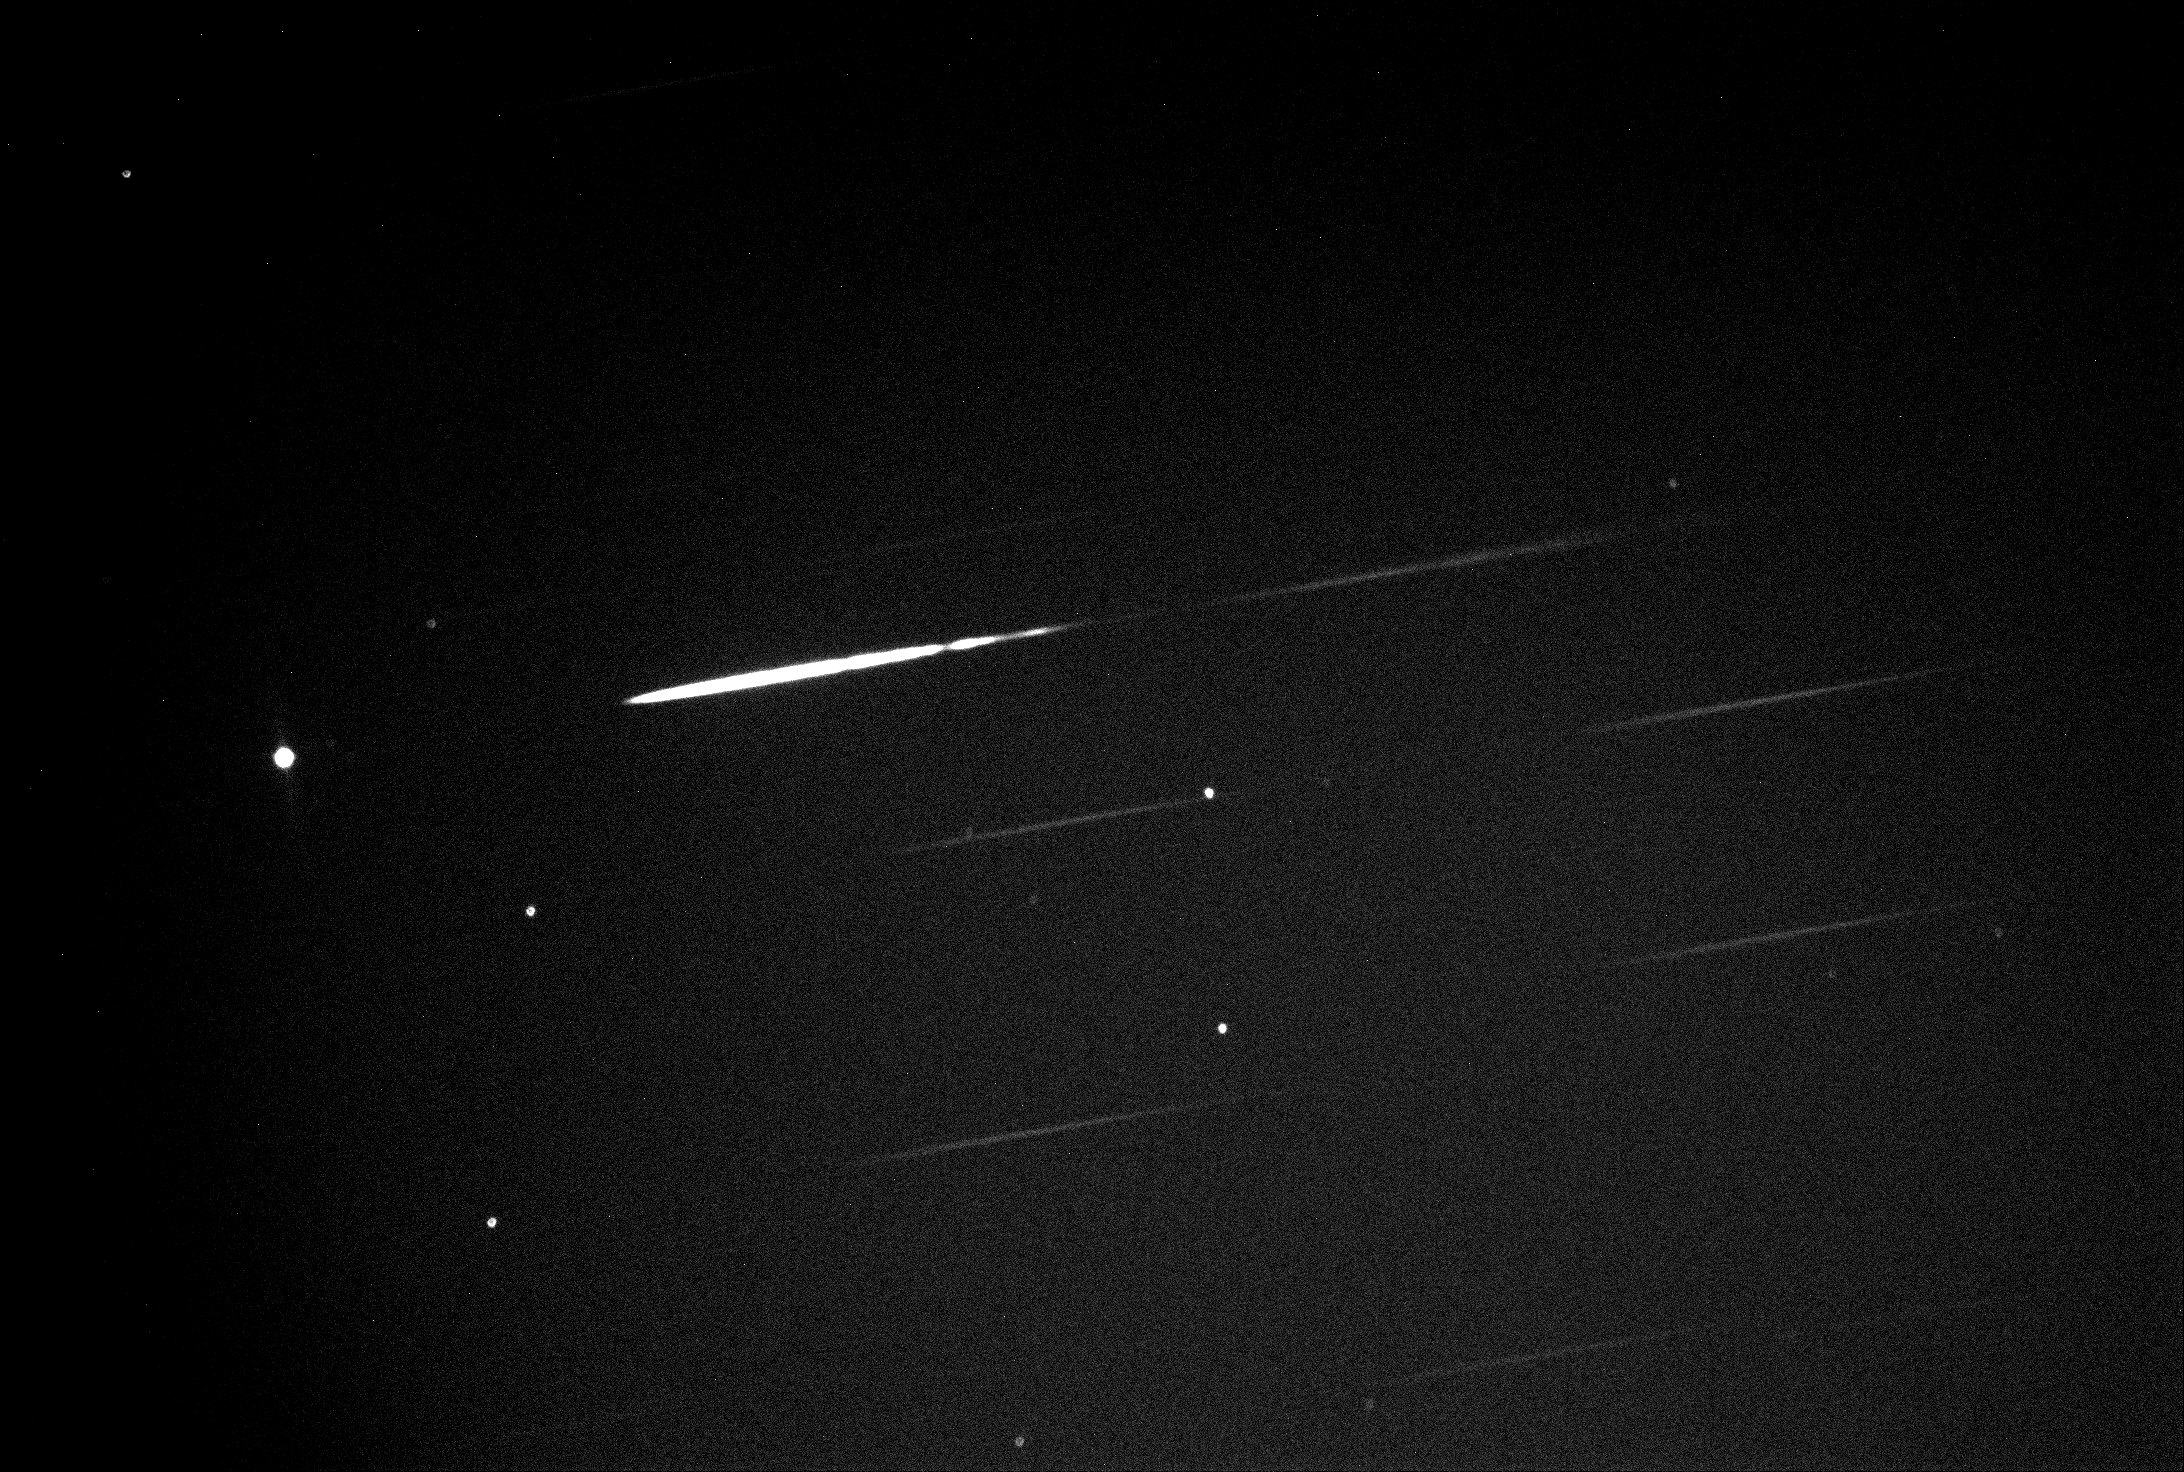
Uranus [D2:1x5s]