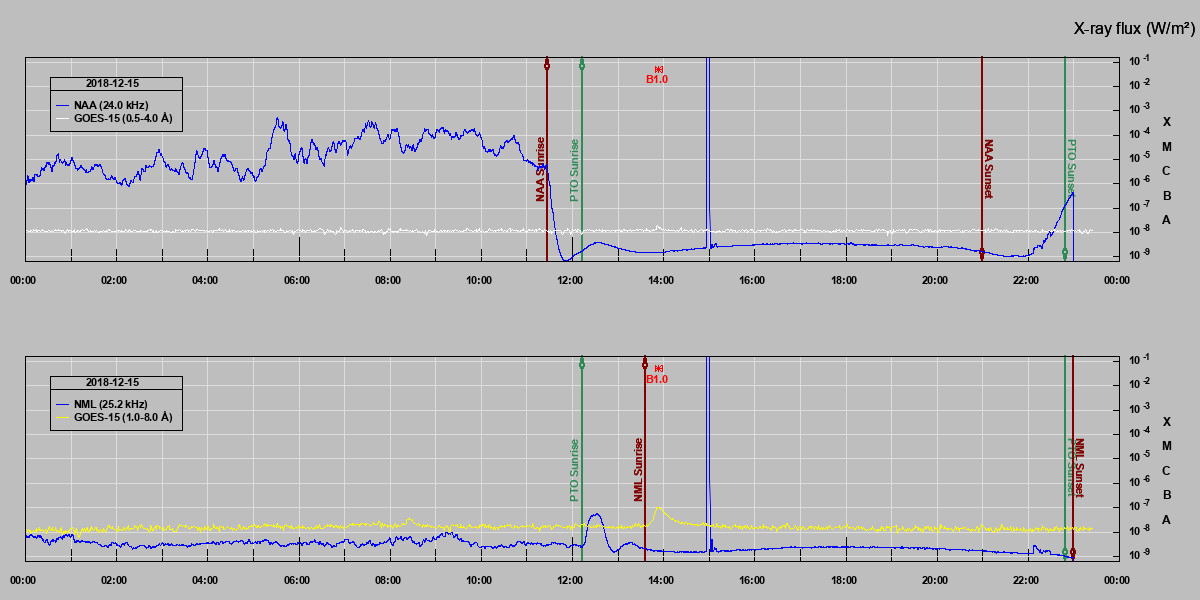
It looks like I got the SID detector remounted just in time. The Sun is coming out of a long, low solar minimum. It is now starting to show an increasing level of activity as evidenced by the number of sunspots starting to show up in the Sun’s photosphere.
I originally installed the observatory’s SID detector at the end of 2018 just as solar cycle 24 was winding down. Even at cycle 24’s maximum, the sunspot count was noticeably low with an even lower count of flares. There was some activity but none that effected the ionosphere enough that my equipment noticed any changes. Then at the end of 2020 I had to take the detector offline due to renovations in the observatory office.
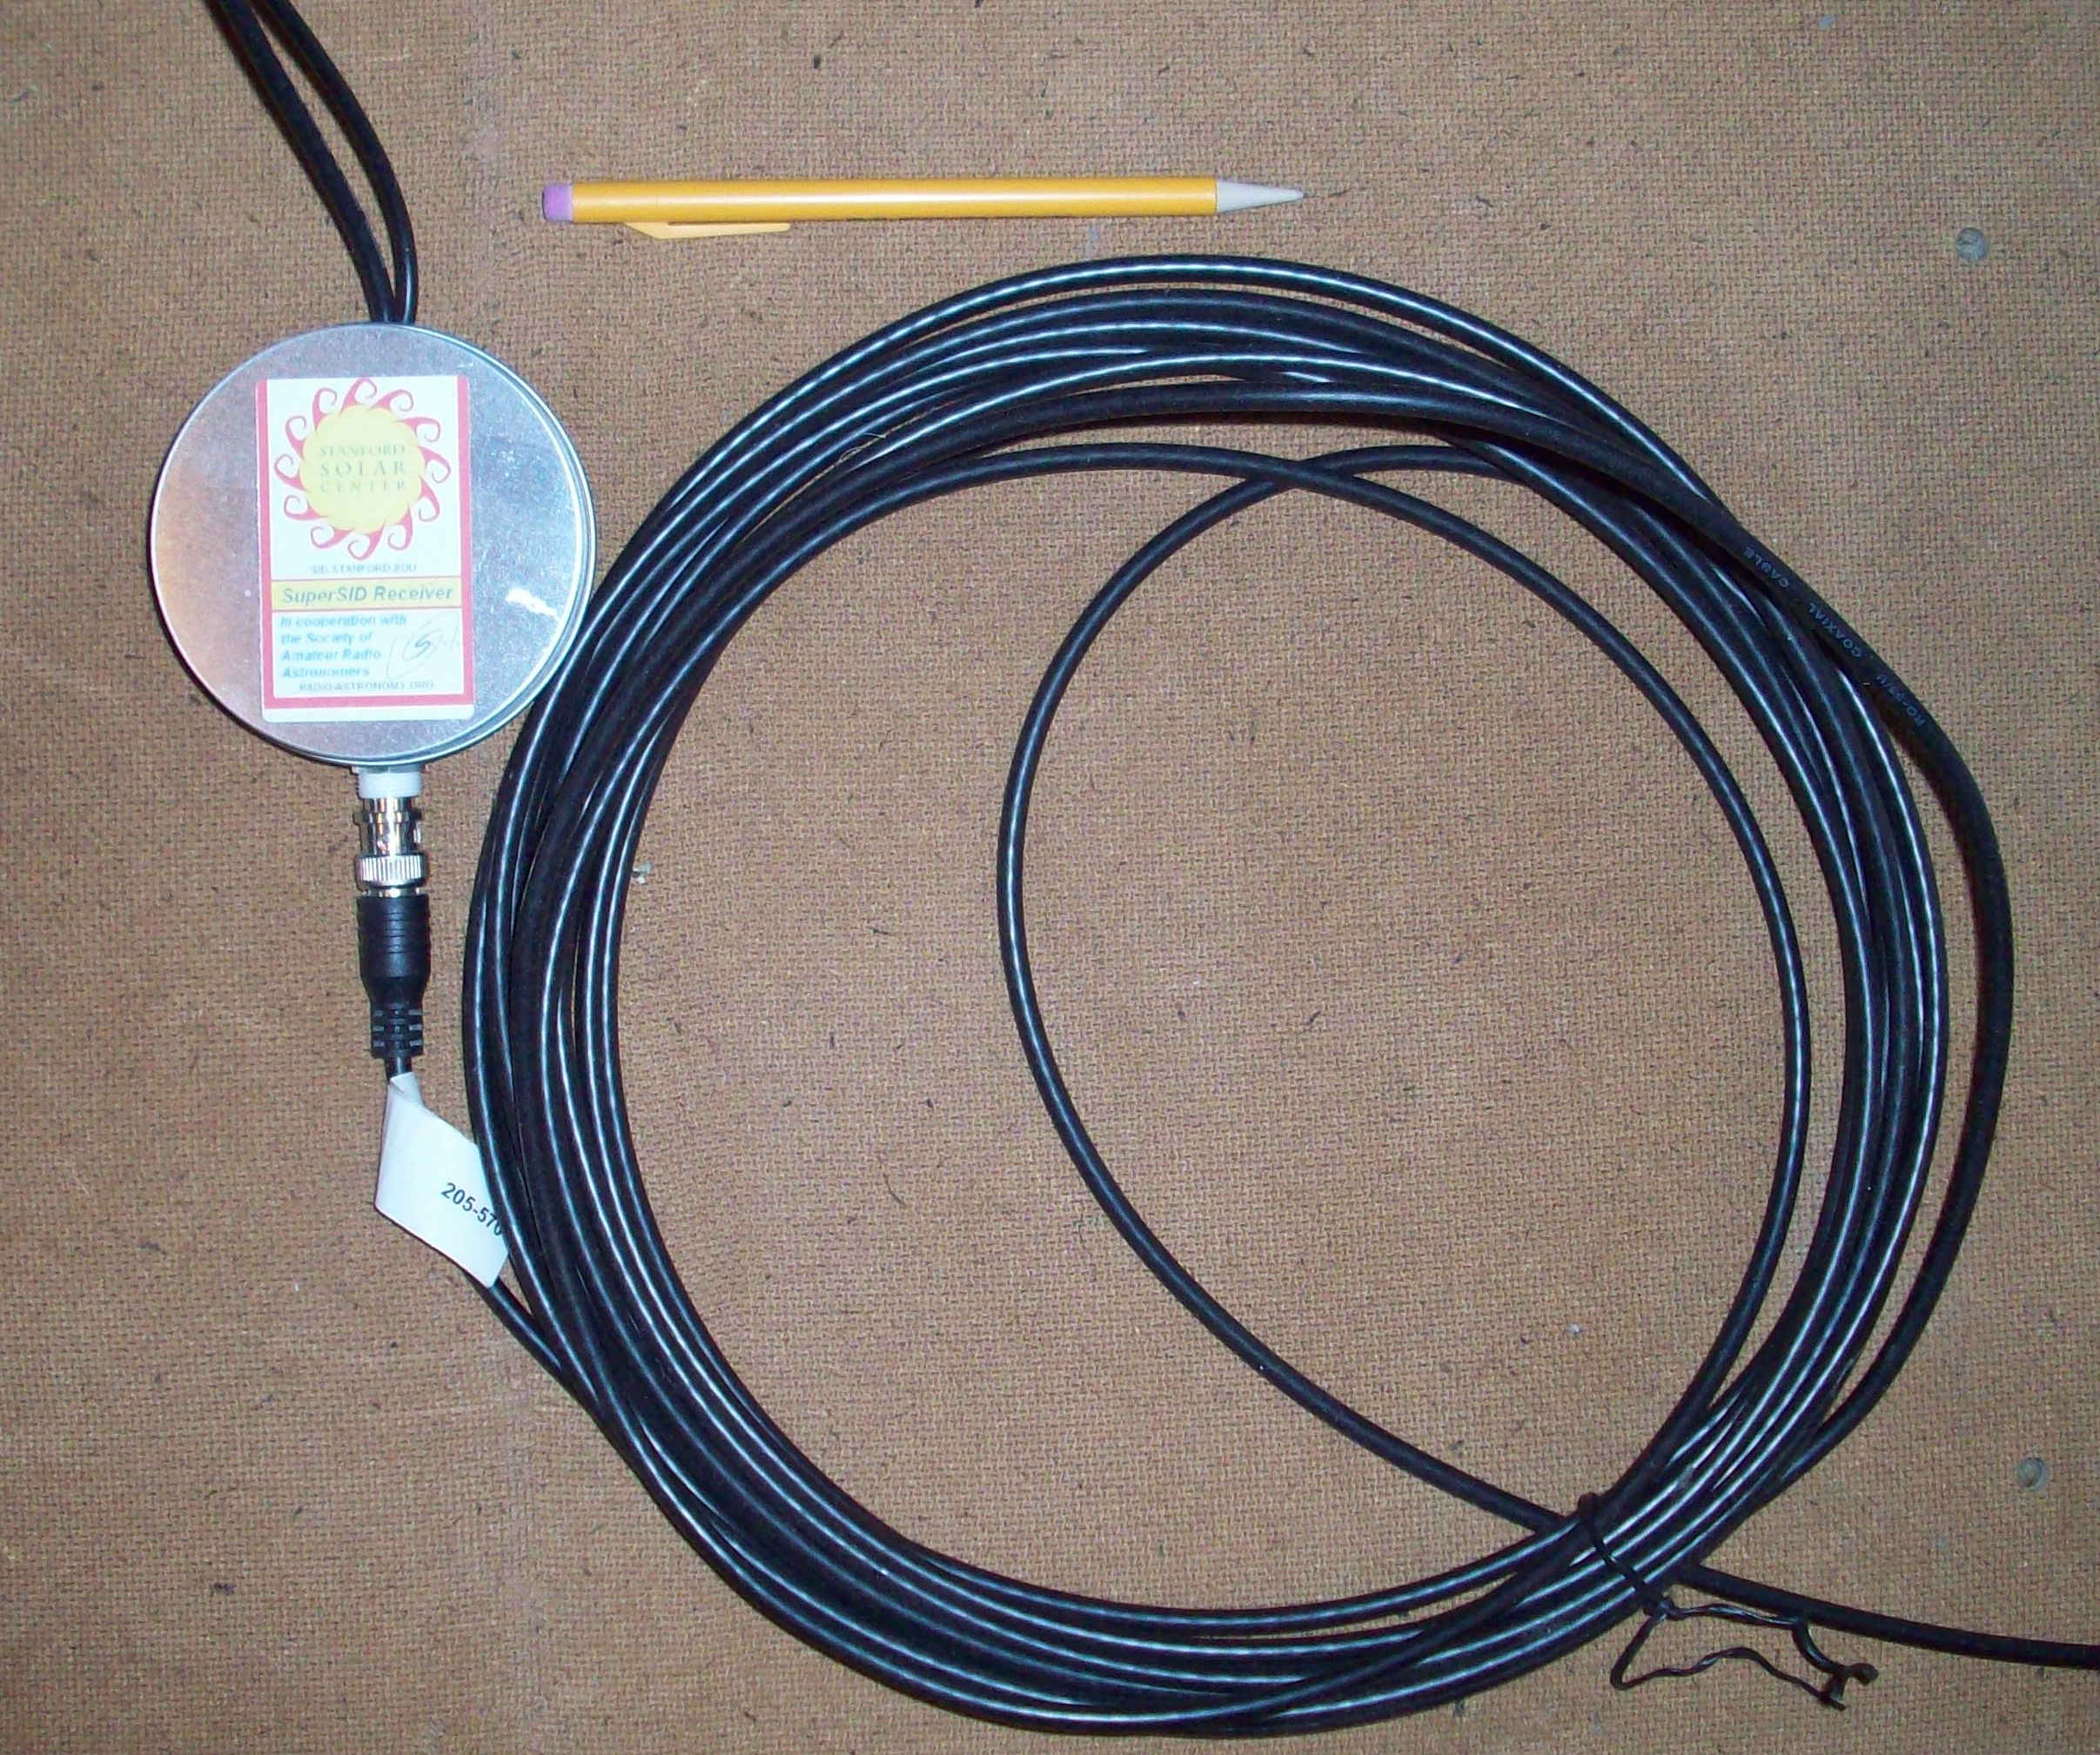
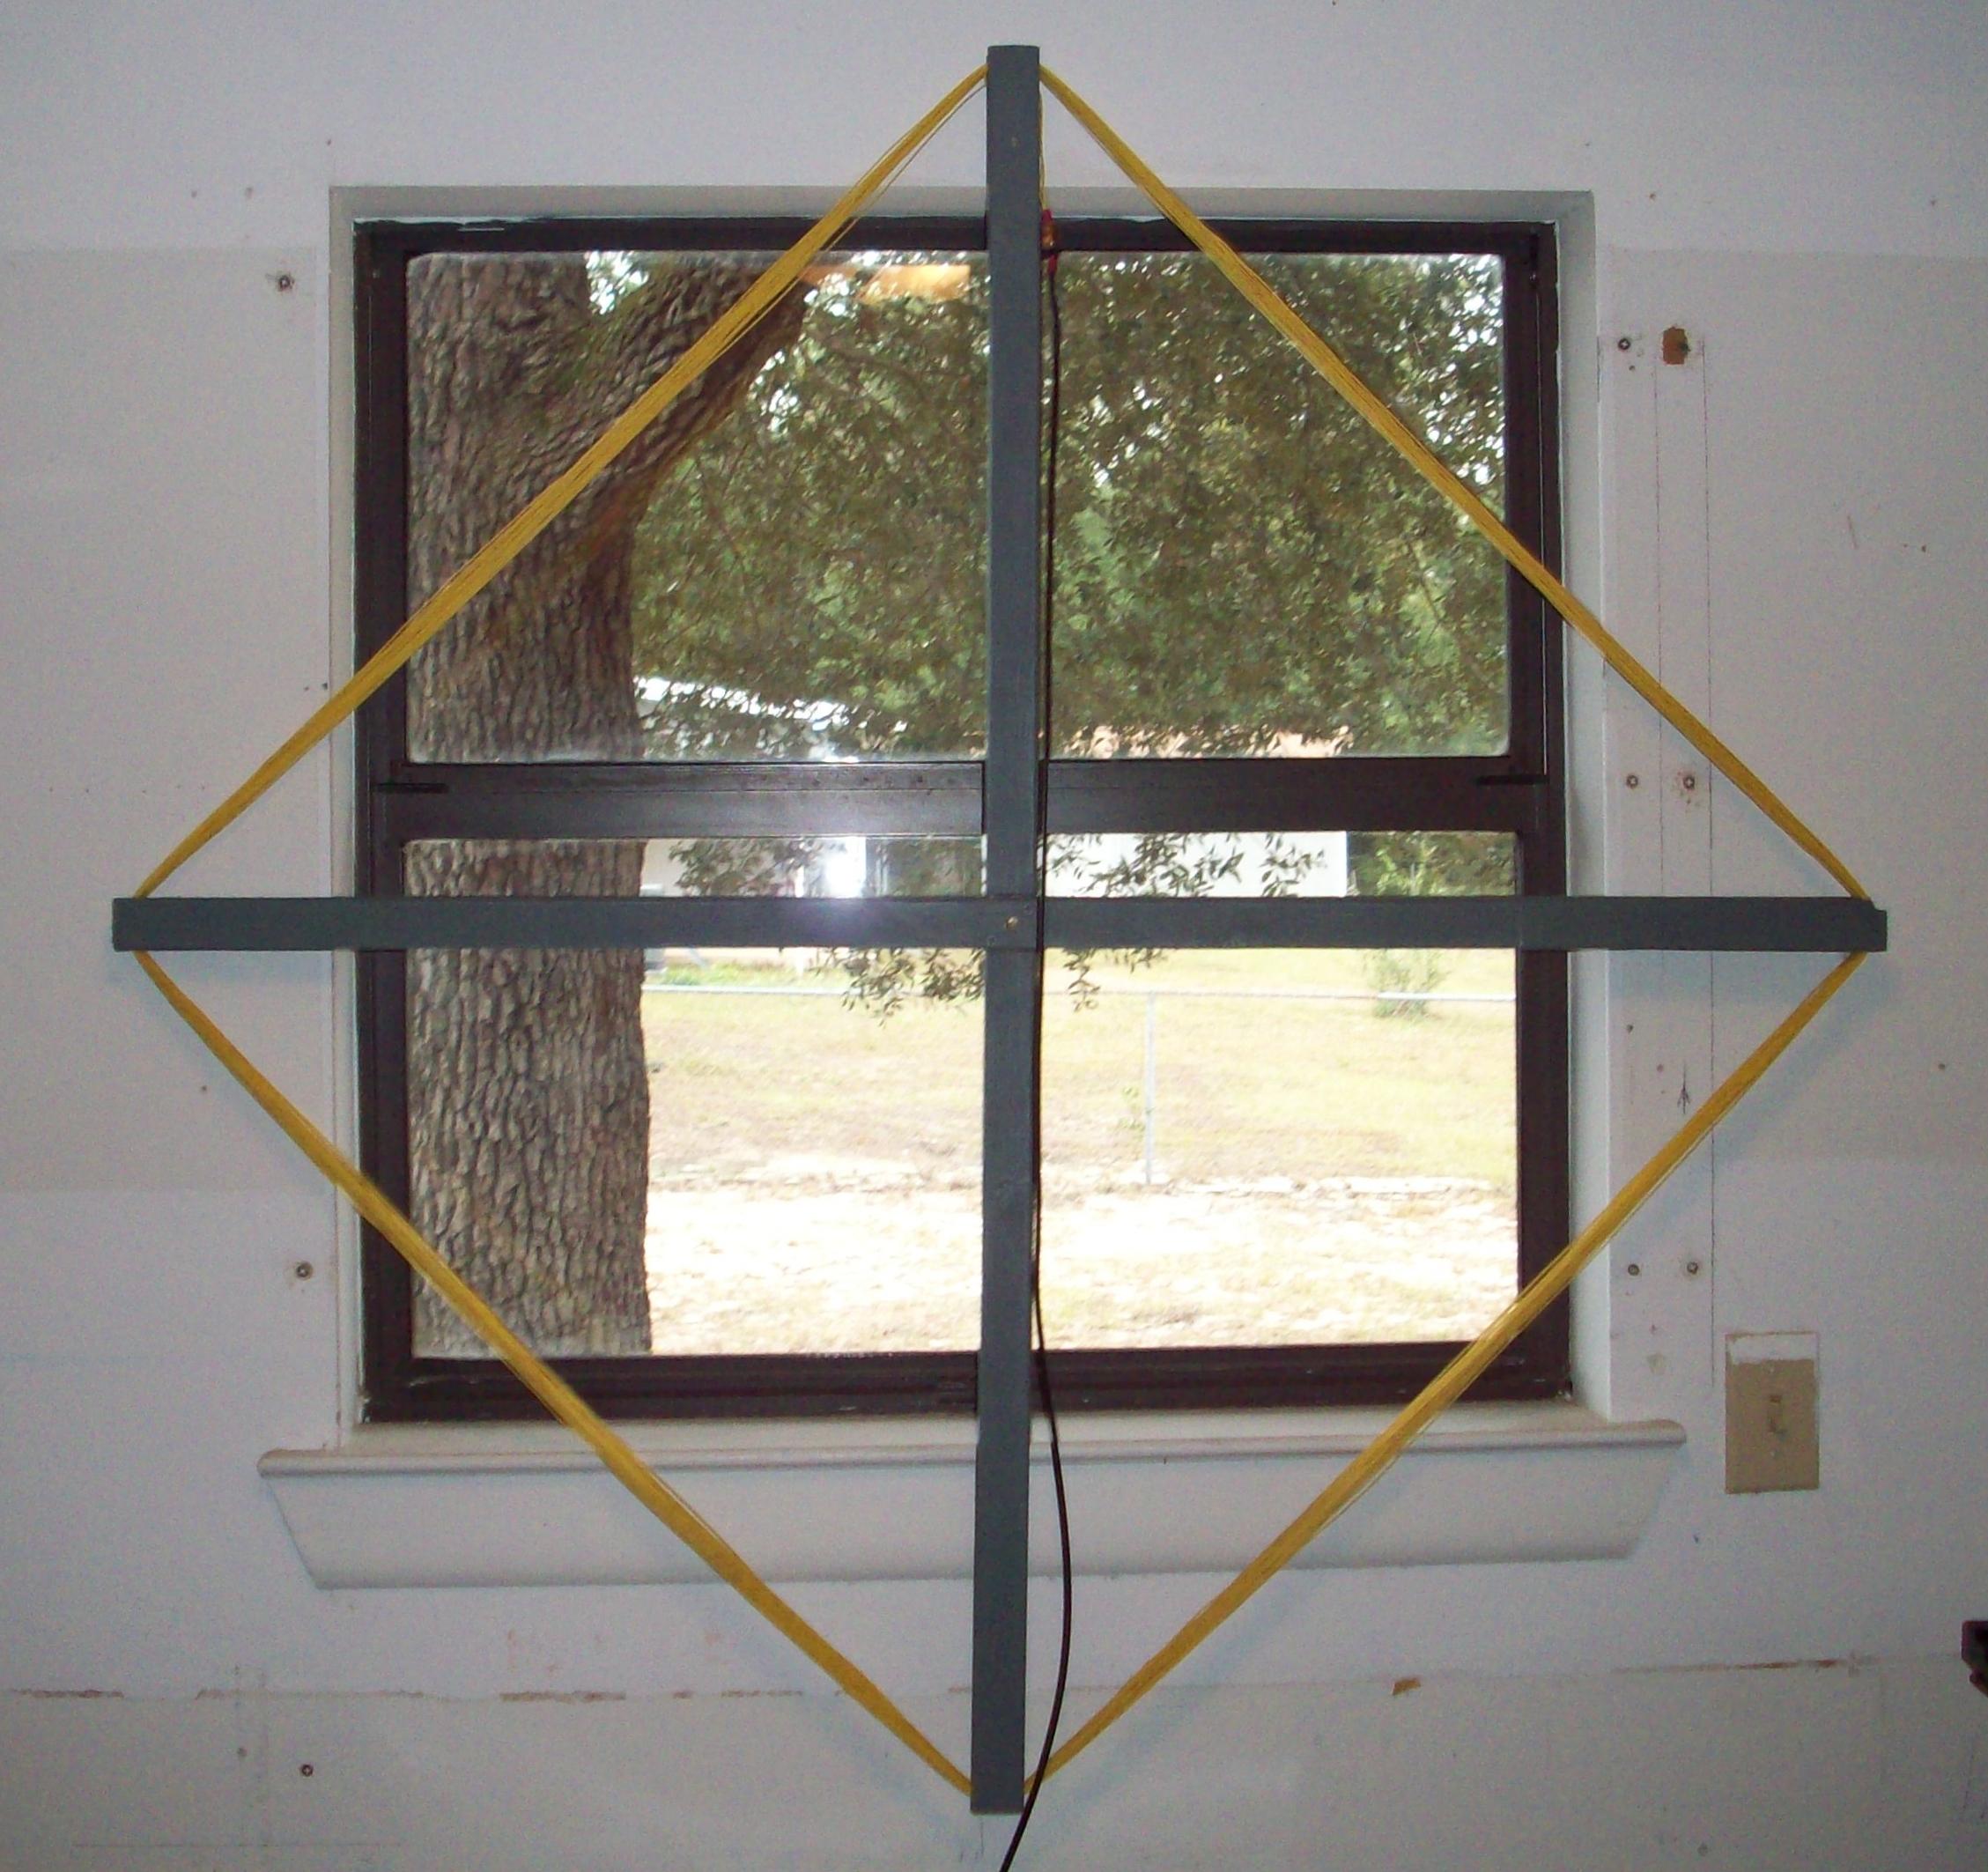
With the solar activity finally starting to increase, I made the effort to finish the reinstallation of the SID equipment. This involved moving the antenna outside and dealing with the complications of routing the cables into the office. I finished that effort on the 17th of January. Even with the number of sunspots and associated flares climbing I still didn’t see any response from my equipment. That changed this past week. There was an M class flare on the 8th that just bumped up the signal I was monitoring. Today however, was the first X class flare that I noticed since I originally installed the equipment.
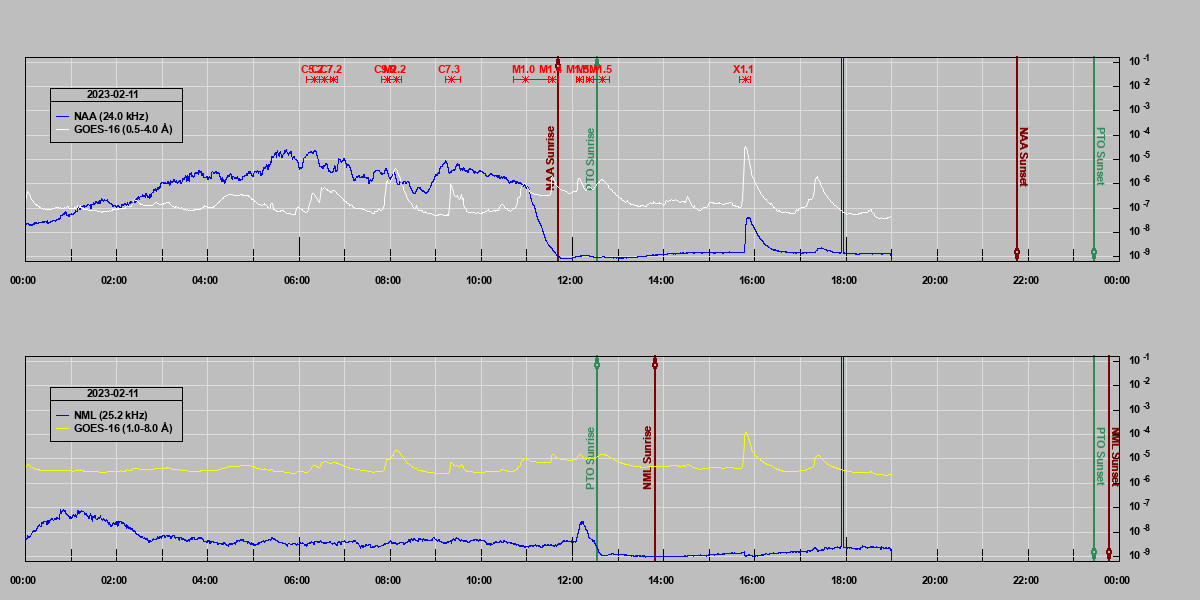
The upper half of the chart shows data reported by the GOES 16 spacecraft as a white line. The same chart shows the signal received by the PTO from the Navy’s NAA VLF transmitter as a blue line. As you can see, even though this was a minimal X class flare (1.1), the impact on the strength of the transmission received immediately increased. A subsequent M class flare resulted in a proportionally smaller increase.
The sunspot count anticipated for cycle 25 is already ahead of prediction. Cycle 25 may be one to pay close attention to. The SID detector data is available using the Observatory->Solar Conditions menu.